Computer Graveyard
A local recycling center is having a special tomorrow, with free recycling of old computers. I have a few old ones lying around, so tonight I decided to drag them all out and get them all ready to go.
I was surprised at how much old computer junk I have accumulated over the past few years. It's really sort of embarrassing to consider how many physical resources were used up to manufacture these things, and now I am getting rid of them. Fortunately they will be recycled as much as possible and the nasty pollutants won't go into a landfill.
It's probably a bit late for this, but if you see anything you would want before tomorrow afternoon, let me know (Seattle-area people only).
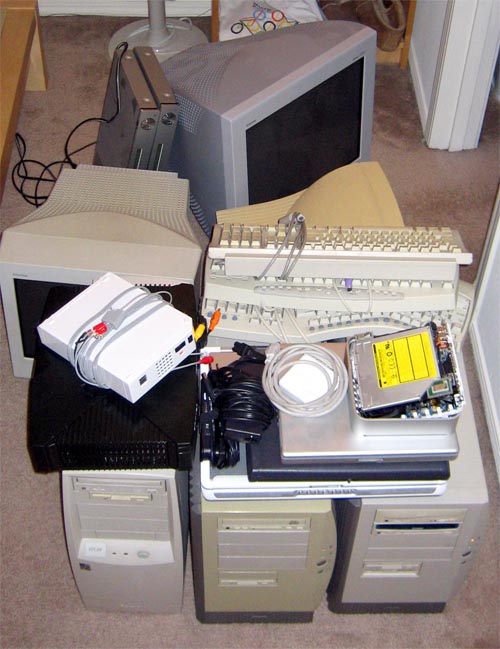
The pile includes:
- 3 old desktop PCs
- An old 200(?) MHz Pentium I computer which my brother found when some local business went bankrupt (If I remember correctly).
- A 500 MHz Pentium III desktop - the first computer I was able to buy and build for myself in high school, after saving for years.
- A 1.8 GHz Pentium IV desktop - the computer I built while in college.
- 3 laptops
- A 500 MHz PIII Dell Inspiron - my first laptop (now dead)
- A G4 12" Apple PowerBook, with bad hard-disk controller (dead)
- Another Dell laptop, this time a P4, with a bad motherboard (dead)
- G4 Mac Mini (dead integrated power supply)
- One extra original XBox (functional - I randomly won it in a contest, keeping the other one)
- One dead Nintendo Wii (killed by my homemade component cable)
- 3 CRT monitors
- 15" Gateway (bad condition, but functional)
- 17" Sony Trinitron (good condition)
- 21" Sony Trinitron (functional, except for a big gash across the glass screen - I filed a BBB complaint against UPS and then got it for free)
- 2 identical Samsung DVD players (the first one got lost by FedEx for 4 months, during which time I had complained and gotten another one for free)
- Bunch of keyboards
Now that I have started preparing to get rid of all the computers, it's taking a surprisingly long time to shred all the hard-disks with a Knoppix CD. I should have started this earlier..
Grossly under-billed
For a while now I've been wondering why I only have to pay $1-2 per month for water. I thought it might have had something to do with all the rain that Seattle gets (lots of extra water, or something).
A letter came today which cleared it up:
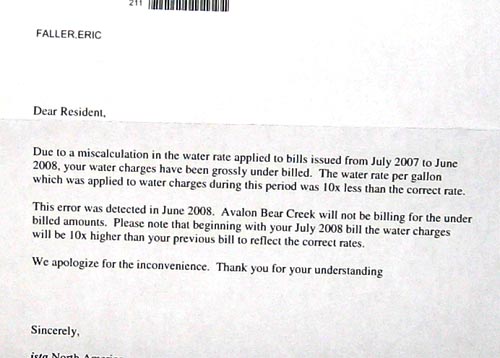
I'm wondering how something like this even happens. How can you not notice that your revenue is ten times less than normal for an entire year? Granted, the error probably only happened in one apartment complex out of many, but still..

Financial Profiling & Optimization
Sometimes I wonder if I am spending too much money and should be saving more. It's tempting to try to micro-manage things by clipping coupons or skipping out on meals out with friends, but this strikes me as being similar to premature optimization of code, which as Knuth would say is the "root of all evil."
Just as it's not worth optimizing the 90% of the code where your program spends less than 1% of its time, it might not be worth packing your lunch every day to save a dollar a day ($250 per year) if your real problem is that you unnecessarily spend thousands of dollars on new laptops or other expensive equipment each year.
So what's the first step before I can figure out what to optimize? Profiling, naturally. About a year ago I grabbed a copy of MS Money, which is a personal finance tracking program. It can go online and download your bank account information and credit card statements. It tracks each transaction you make and uses heuristics to assign them to various expense categories. For example if Safeway is the merchant, it'll assign it to Groceries, if it's Comcast, then Utilities, and so on. Sometimes it doesn't know what a specific merchant should be assigned to so you have to configure it.
Once that's all set up, it can generate all kinds of plots showing your cash flow over time, estimated monthly budgets based on trended spending, and various other reports. Here's a pie chart of my spending over the last year:
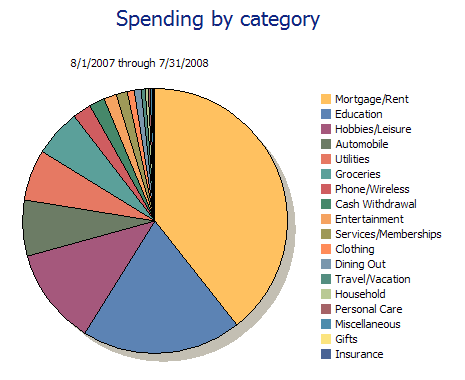
Without this tool I would probably have had a hard time even estimating the percentage of my spending which goes into various categories, so it was quite interesting to see it charted like this.
The biggest item that jumps out of the chart is obviously "Mortgage/Rent", which in my case is just Rent. It accounts for nearly half of my spending, if you include Utilities (electricity, water, internet) along with it. I'm not sure whether this is a good or bad observation: on one hand I am spending a ridiculous amount of money on rent each month, but on the other hand it's nice to know that I'm not spending a similarly ridiculous amount of money on anything else.
"Education" is the next biggest category, which includes grad school tuition, fees, textbooks, etc.. I'm OK with spending a good chunk of money on this category since self-improvement and continual learning is a good thing. It's also nice that these expenses are completely reimbursed by Microsoft, so the chart of my "real" expenses should probably not even include this category (in which case Mortgage/Rent would fill more than half the pie).
Next biggest is "Hobbies/Leisure", which contains a large range of transactions, the largest of which are from "AMAZON.COM", "GAMESTOP/EBGAMES", "APPLE ONLINE" and "REI STORES." Overall I'm not too concerned about the current size of this pie slice since Hobbies/Leisure is basically the category for "what you do with your spare time," which, in the end, is the whole point of working and making money. I was a bit surprised at the total cost of my Amazon purchases over the last year - I could probably be a lot better about borrowing "read once" books from the library rather than buying them outright (Amazon Prime makes it too easy..).
"Automotive" is up next, which seems to be about equally split between car insurance and gas. I think I already have my car insurance pretty well optimized, so about the only way to reduce spending here is to drive less.
I'm lumping Utilities in with Mortgage/Rent, so "Groceries" is next. The final number in this category was another minor surprise and is probably a good area for optimization. Whole Foods organic milk and cereal apparently add up pretty quickly.
The rest of the spending categories don't sum up to much, so some of them are actually surprising for being so small. I'm disappointed that "Travel/Vacation" is almost not even visible on the chart. I hope that next year's chart will show Travel/Vacation making some big gains. "Gifts" is one category which is too small to show up, which would be totally pathetic of me if it weren't for the fact that most of my gift purchases were probably from Amazon and thus got stuffed into the Hobbies/Leisure slice.
One thing which is notably missing from this chart is money allocated to savings accounts & stock investments (I guess they aren't "Spending" since I still have the money). I had to generate a separate report for savings & stock investments and was pleased to find that the total number there was about equal to the total number in the Spending chart, which means that I have a savings rate of 50%, which is a lot better than the U.S. average, which is hovering around 0% even with the recent "stimulus" package.
Overall this was an interesting exercise to do. Now that I know the actual numbers I don't feel all that guilty about spending too much (except for in a couple of areas). In fact, I'm now feeling like I can probably afford to spend more, especially in "Travel/Vacation".
Me

Apps


Search
Archives
- July 2013
- May 2013
- April 2013
- March 2013
- February 2013
- January 2013
- December 2012
- November 2012
- October 2012
- September 2012
- August 2012
- July 2012
- May 2012
- April 2012
- March 2012
- February 2012
- January 2012
- December 2011
- November 2011
- October 2011
- September 2011
- August 2011
- July 2011
- June 2011
- May 2011
- April 2011
- March 2011
- February 2011
- January 2011
- December 2010
- November 2010
- October 2010
- September 2010
- August 2010
- July 2010
- June 2010
- May 2010
- April 2010
- March 2010
- February 2010
- January 2010
- December 2009
- November 2009
- October 2009
- September 2009
- August 2009
- June 2009
- May 2009
- April 2009
- March 2009
- February 2009
- January 2009
- December 2008
- November 2008
- October 2008
- September 2008
- August 2008
- July 2008
- June 2008
- May 2008
- April 2008
- March 2008
- February 2008
- January 2008
- December 2007
- October 2007
- September 2007
- August 2007
- July 2007
- June 2007
- May 2007
- April 2007
- March 2007
- February 2007
- January 2007
- December 2006
- November 2006
- October 2006
- September 2006
- August 2006
- July 2006
- June 2006
- May 2006